

Imbalances of health workforce across the EU27 - Health workforce volume per capita
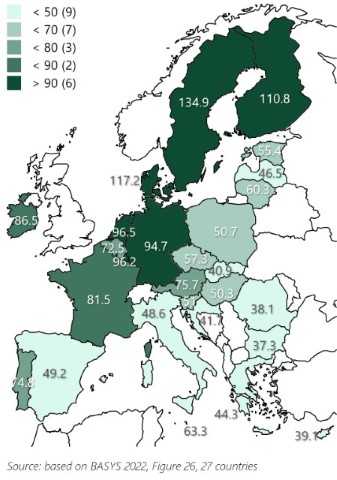
The amount of health workforce per capita can be measured in persons, full-time equivalents or working hours. The Figure below shows the variations across EU Member States in hours worked. On average, 68.4 hours of health and social services including long-term care were provided in the EU27 in 2017. Sweden has the highest hours per capita, Bulgaria the lowest. Germany, with 94.7 hours, is among the six countries with over 90 hours of work per inhabitant. In nine Member States, on the other hand, the population has to get by with less than 50 staff hours. These include above all the southern member states, where long-term care is provided at home.
Figure: Health workforce volume per capita in hours, 2017
In almost all MS, the volume of health workforce per capita increased between 2007 and 2017. Denmark and Latvia recorded a decrease in per capita hours of health personnel (-6.3 and -0.5% in 2017 compared to 2007). The highest volume growth rates were recorded in Luxembourg and Portugal, with 26.5% and 21.5% respectively. In Germany, the increase was 19.4%, well above the EU average growth rate of 12.9%.
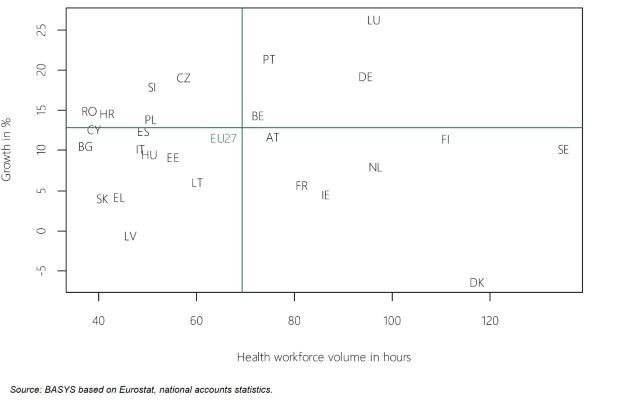
Further interesting results shows the Figure below which shows whether a country could improve its position relative to the EU average. All countries in the bottom-left corner of Figure below could not improve their relative position, among them Latvia, Slovakia, Greece, Bulgaria, and Cyprus. Countries in the top left corner could improve their health workforce above the EU growth rate, however, their volume of health workforce was still below the EU average in 2017. Except Greece and Italy, all countries at the left side of Figure 27 are in Central and East Europe. The “stars” under the MS were Luxembourg, Germany, Portugal, and Belgium, because they performed “better” in level and growth of the health workforce volume per capita.
Figure: Health workforce volume matrix, Sector Q
The summary report can be downloaded here: BASYS 2022 - HWF Summary Report.pdf