


Drivers of German Health Expenditure Flows, 2024 compared to 2014
Treiber der deutschen Gesundheitsausgaben, 2024 im Vergleich zu 2014
| In order to make proposals to stabilise the social contribution rates of the German Statutory Health Insurance system (SHI), the Finance Commission of Health (FKG) has examined the drivers of SHI expenditure [1]. Health expenditure accounts provide a systematic overview of those factors driving expenditure outside the scope of the SHI. This shows that long-term care is the main driver of the increasing burden on households, in both absolute and relative terms. | Die Finanzkommission Gesundheit (FKG) zur Erarbeitung von Vorschlägen zur Stabilisierung der Sozialbeitragssätze der Gesetzlichen Krankenversicherung (GKV) orientierte ihre Vorschläge an den Treibern der GKV-Ausgaben [1]. Die Gesundheitsausgabenrechnung ermöglicht einen systematischen Überblick über diese Treiber über die GKV hinaus. Dabei zeigt sich, dass sowohl absolut als auch relative die Ausgaben für Langzeitpflege der Haupttreiber der zunehmenden Belastung der Haushalte ist. |
Financing schemes
In Germany, Statutory Health Insurance (SHI) finances about 56% of Germany’s health care expenditures. Important expenditure flows are added by other schemes, such as Social Long-Term Care Insurance (SLTI), or Out-Of-Pocket expenditures of households (OOP). In analysing the drivers of health care expenditures, these other expenditure flows need to be included, to obtain a complete picture of the money circulating in the system. Also, the burden on households from contributions, taxes, and direct payments, goes far beyond the SHI contribution rates. To show the change in this burden over time, the increases in expenditure flows from 2014 to 2024 are displayed in figure 1. These reached EUR 210.5 bn in 2024, resulting in growth in total health expenditures from EUR 327.7 bn to EUR 538.2 bn [2].
This analysis shows that SHI dominates the additional spending. In 2024, SHI spent EUR 110 bn more on healthcare than ten years earlier. But the other financing schemes together spent an additional EUR 100 bn, which emphasizes the significance of these additional flows for the revenues of providers.
Figure 1: Flows of the EUR 210 bn additional health expenditures in 2024 as compared to 2014
Providers
Who benefited most from these flows? Figure 1 shows that long-term care units gained most from the EUR 210 bn increase in expenditures. Long-term care units (outpatient and inpatient units) received an additional EU 64 bn (30.4%). Hospitals, including rehabilitation clinics, followed in second place, receiving an increase of EUR 50 bn (23.8%). Medical and dental offices including practices of ancillary professions followed in third place with EUR 45 bn (21.4%).
Expenditure on pharmacies and sanitary shops received the fourth highest increase, EUR 31 bn (14.9%), with the relatively lowest expenditure increase, below even administration, which received a further EUR 9 bn (4.3% of EUR 210 bn). The additional money spent on public health offices and rescue services (EUR 11 bn, 5.2%) was highly volatile in the period 2014-2024, due to the Corona pandemic.
Out-Of-Pocket expenditures
The significance of looking at SHI in isolation becomes particularly clear when analysing Out-Of-Pocket expenditures. In 2024, households paid an additional EUR 21.4 bn compared to 2014. Total OOP reached EUR 64.9 bn, 12% of the total health expenditures of EUR 538.2 bn. In 2014, the OOP to THE (total health expenditure) ratio was 13.2%, indicating an improvement in Universal Health Coverage as defined by WHO [3].
OOP expenditures are very unevenly distributed across health care goods and services. For some types of health goods and services, OOP is a substantial part of health financing. The annual accounts of SHI designate only EUR 4.9 bn, out of a total EUR 64.9 bn OOP, as cost-sharing. However, depending on the type of health expenditure, OOP amounts to far more than EUR 4.95 bn (see Figure 2).
Figure 2: OOP additional expenditure by type, 2024 compared to 2014
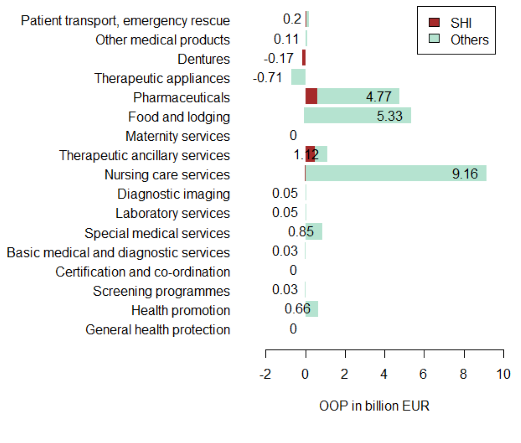
The cost-sharing regulations of SHI aim to avoid hardship due to OOP. Therefore, all cost-sharing regulations have upper limits (see Box 1). This holds only for goods and services defined in the SHI "Standard Package" health basket (Regelversorgung). SHI has certainly been successful in containing cost-sharing. For example, for items 1) to 8) this increased by only EUR 1.3 bn, mainly represented by items 1) to 3), which include pharmaceuticals and medical goods.
But OOP outside the SHI-basket has been growing fast, by approximately EUR 20.2 bn in the period in question. The most important OOP expenditure drivers have been fees for nursing homes, increasing by EUR 7.7bn, home care EUR 6.5 bn, and pharmaceuticals EUR 5.1 bn. Any discussion of the cost-sharing regulations of SHI should take into account these other burdens, because OOP results from a complex interaction of disease patterns and the way in which treatment is organised (see [4], fig 1.)
Box 1: Cost-sharing regulations of SHI
- retail pharmaceuticals: 10% of the retail price, minimum €5, maximum €10, per prescribed drug
- medical goods: 10% of the retail price minimum €5, maximum €10, per medical good
- physiotherapy: 10% of the cost plus €10 per prescription
- travel cost 10% of the cost, minimum €5, maximum €10, per transport
- home care 10% of the costs per day for a maximum of 28 days per year plus €10, per prescription
- home help 10% of the costs per day, minimum €5, maximum €10
- hospital inpatient stay: €10 per day for a maximum of 28 days per year
- rehabilitation inpatient stay: €10 per day for a maximum of 42 days per year; for follow-up rehabilitation for a maximum of 28 days per year
Outlook
Changing financial flows across the whole health system provide revealing insights into the drivers of health expenditures and the burden on households through direct payments, contributions, and taxes. Analysing these flows throws light on the dynamics of resource allocation across diseases and activities. Tracking changes in flows offers a platform for discussion of the macroeconomic impacts of cross-sectoral innovations (see e.g. [5]). Cross-sectoral analysis of SHI, LTCI, and OOP, by services and diseases, is necessary to understand better the fragmented and historically intertwined financing structures of the German health system.
References
[1] www.finanzkommission-gesundheit.de.
[2] https://www.destatis.de/EN/Themes/Society-Environment/Health/Health-Expenditure/Tables/sources-of-funding.html, retrieved 29.04.2026.
[3] WHO (2025) Tracking out-of-pocket health expenditure under System of Health Accounts 2011, Geneva; 2025. Licence: CC BY-NC-SA 3.0 IGO.
[4] https://www.basys.de/aktuelles/2024/financial_flows_germany.php.
[5] https://www.basys.de/aktuelles/2025/Sektoruebergreifende_Innovationen_im_Gesundheitssystem.php.
[6] BMG KJ1, Finanzergebnisse der GKV, https://www.bundesgesundheitsministerium.de/themen/krankenversicherung/zahlen-und-fakten-zur-krankenversicherung/finanzergebnisse; 02.05.26
Authors
Markus Schneider, Thomas Krauss, Marian Craig
The PDF-Version of this article can be downloaded here.